CONFLUENCE TRADING STRATEGY
Welcome Forex255.com ,The best website where you will be taught on how To trade with various strategies but also Forex news will be published here daily
Prepared by FradoFx
What Is Confluence Trading?
In this post, you will get your answer to what is confluence trading.
You wan’t to see some examples of confluence trading with price action is all about?
Well, in this post, I will:
show you what confluence trading really is and if you are a price action trader, this trading technique is one that you should know. No excuse!
give you 4 major areas or levels where confluence trading really happens where you can take high probability trades and trading.
give you examples of the confluence trading setups you should be looking out for.
The fact is, you may may have done confluence trading without really knowing what you were doing or really didn’t know the “name” for it.
In order to trade confluence, you really have to have a good grasp or understanding of price action trading.
Now, lets define some terms….
Confluence Trading Definition
Confluence Trading
When you have two or more levels come together at a certain point on your chart , that’s confluence. Confluence trading is the same kind of situation when two different rivers meet.
Examples in forex trading can be any of these:
It can be a a trendline coming together at at 61.8% or 50% fibonacci level.
it can be a support level meeting a rising trendline
it can be a Fibonacci level meeting a support level where price meet
Price Action Trading Definition
Price action is defined as the movement of price over a specific amount of time. So the definition of price action trading trading is this: price action trading is a trading method that allows a trader to read the market and make subjective trading decisions based on the recent and actual price movements, rather than relying solely on technical indicators.
Confluence Trading With Price Action Examples
The 4 main areas or levels where confluence trading can happen are these:
support levels
resistance levels
fibonacci level
trendlines
Now, lets go through each of these and give you 4 examples of each so you know that what confluence trading with price action is all about.
As a matter of fact, these are the 4 Confluence Trading Price Action Techniques every forex trader needs to know.
Let me start with the first…
#1: Support Level Confluence Trading
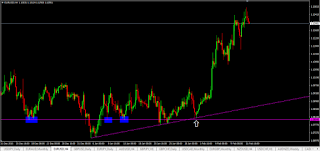
With this chart example below, these are the things you should notice right away:
support levels in blue boxes….
price has tested support levels on previous occasions and the levels held.
then notice also that there is the rising trendline as well providing another confluence factor to that support level.
so when price went down again to the zone of that level (white arrow), the trendline was providing support as well as it was in a support level zone as well.
so what did price do? It shoots up.
confluence trading price action on support level
#2: Resistance Level Confluence Trading
In this chart below, notice that there was a support level that was broken (in blue box) and price was heading up….so this was a potential support-turned-resistance level coming into play here.
the confluence trading factor comes into play here when you notice that if you were to draw a fibonaci retracement level, price actually turned down from the 38.2 fib level
so what you have here are two things: a resistance level and a fibonacci level…so two things coming together at a meeting point.
so what happens next when they meet? Price falls. This is confluence trading with price action.
confluence trading price action on resistance level
#3: Fibonacci Level Confluence Trading
If you love fibonacci, trading confluence with fibonacci is a skill all traders should posses. In this example below, you will notice that:
price was in an uptrend and eventually it started to head back down.
now you have the high and low required to draw your fibonacci level to give you an idea of the price levels where price will start to move up again.
but hang on, there’s some important support and resistance levels in the past that you can see that price has broken already (those in blue boxes). Will they play a part in moving price back up again?
Sure enough, price comes down, hits the 50% fib level as well as hits the zone of those past level and shoots back up.
This is confluence trading…
Confluence Trading Price Action with Fibonacci Levels
#4: Trendline Confluence Trading
Notice below, you could have drawn a trendline and waited for price to come up to it so you can sell as price hits the falling trendline.
You could also have pulled up the Fibonacci retracement tool and seen that as soon as price hits the trendline, that level coincided with the 61.8 fib level.
so you have a trendline and price heading up to it
and at the place where price meets trendline coincides with 61.8 fib level.
that’s confluence trading with price action right there.
the odds of your trade succeeding with such trading setups increases.
confluence trading price action with trendlines
GOODNEWSYou can now trade even on weekends click The link below for more details
https://record.binary.com/_RwtRy7yBNJi6tyDIijdDK2Nd7ZgqdRLk/1/


Hello everyone..Welcome to my free masterclass strategy where i teach experience and inexperience traders the secret behind a successful trade.And how to be profitable in trading I will also teach you how to make a profit of $12,000 USD weekly and how to get back all your lost funds feel free to email me on(brucedavid004@gmail.com) or whataspp number is +22999290178
ReplyDelete